AI-Powered Data Analytics
Automated Insights Without the Complexity
QuantumLayers automatically integrates, analyzes, and visualizes your data –
then explains what it means in plain language.
Your Data Lives Everywhere. Your Insights Shouldn’t Have To Wait.
Most businesses run on data spread across a CRM, a PostgreSQL database, a handful of Google Sheets, and a dozen exported CSVs. Traditional BI platforms can visualize it — but only after your data team spends weeks building ETL pipelines, aligning schemas, and maintaining fragile connectors. QuantumLayers eliminates that entire layer. Connect your sources, and your analysis is ready in minutes.
–
No-Code Data Integration: Connect SQL, APIs, Google Sheets, SFTP and CSV
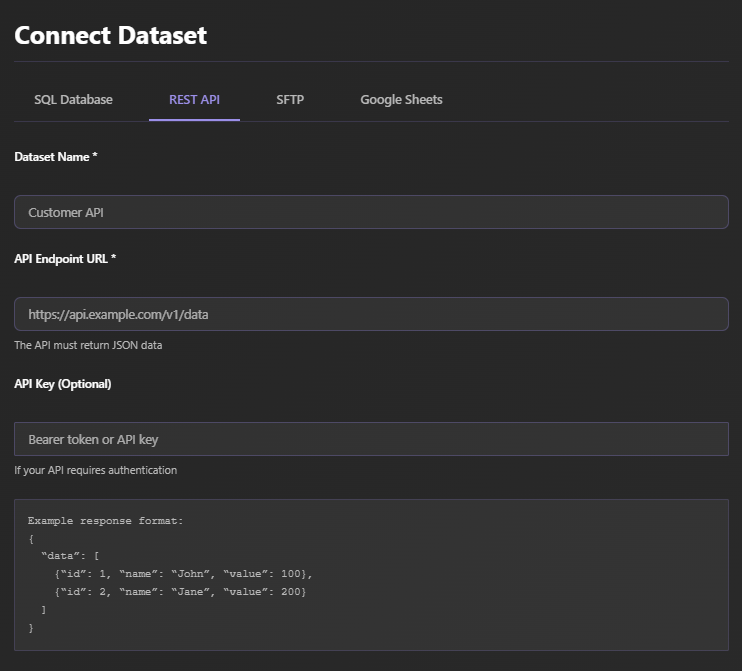
QuantumLayers connects directly to your data sources. From CSV files to SQL databases, going through REST APIs, SFTP storages and Google Sheets — no migration, no duplication, no proprietary data warehouse required. Your raw data stays exactly where it is, under your control. The platform queries it live and keeps it synchronized automatically.
Automated Multi-Source Data Merging – No ETL Pipelines, No Data Engineering
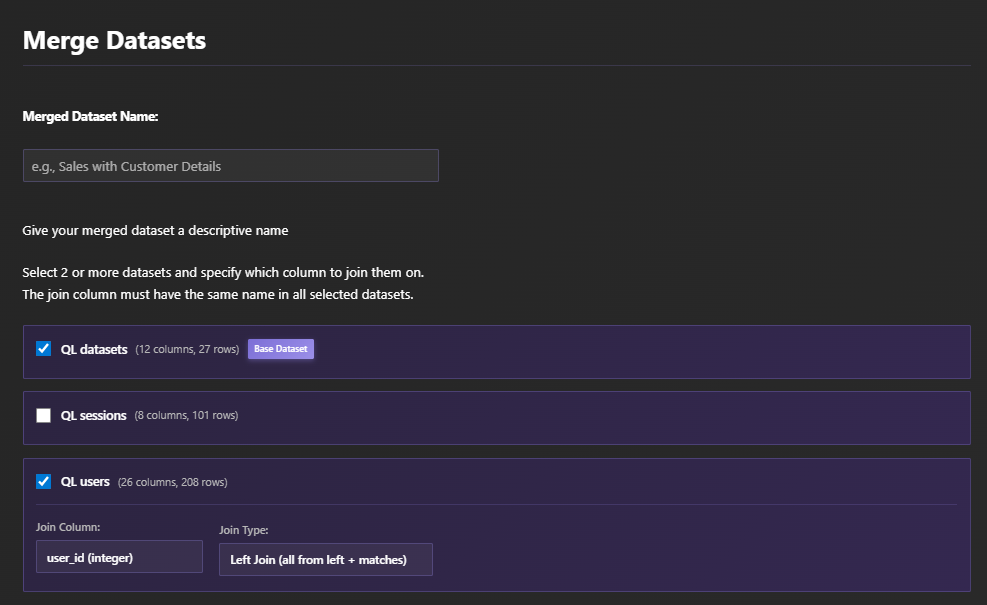
Building joins across multiple data sources is where most analytics projects stall. Schema alignment, unique identifier mapping, timestamp normalization, deduplication — traditional data pipelines can take weeks to build and break constantly. QuantumLayers eliminates that entirely.
Data Visualizations Made Simpler Than Ever
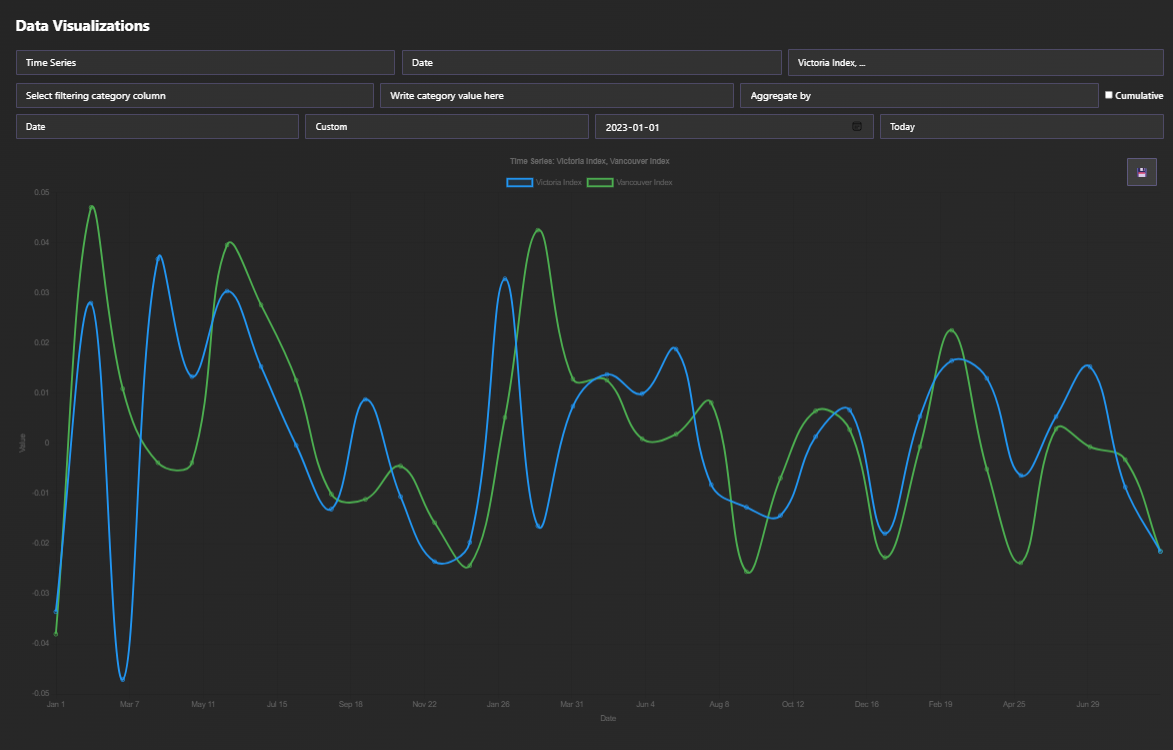
Work with 14 different types of visualizations, from time series charts to violin plots, going through bubble charts and heat maps, and perform on the fly correlation, principal component, and ANOVA analysis within a few clicks.
Visualize What Matters Most – Without Intervention
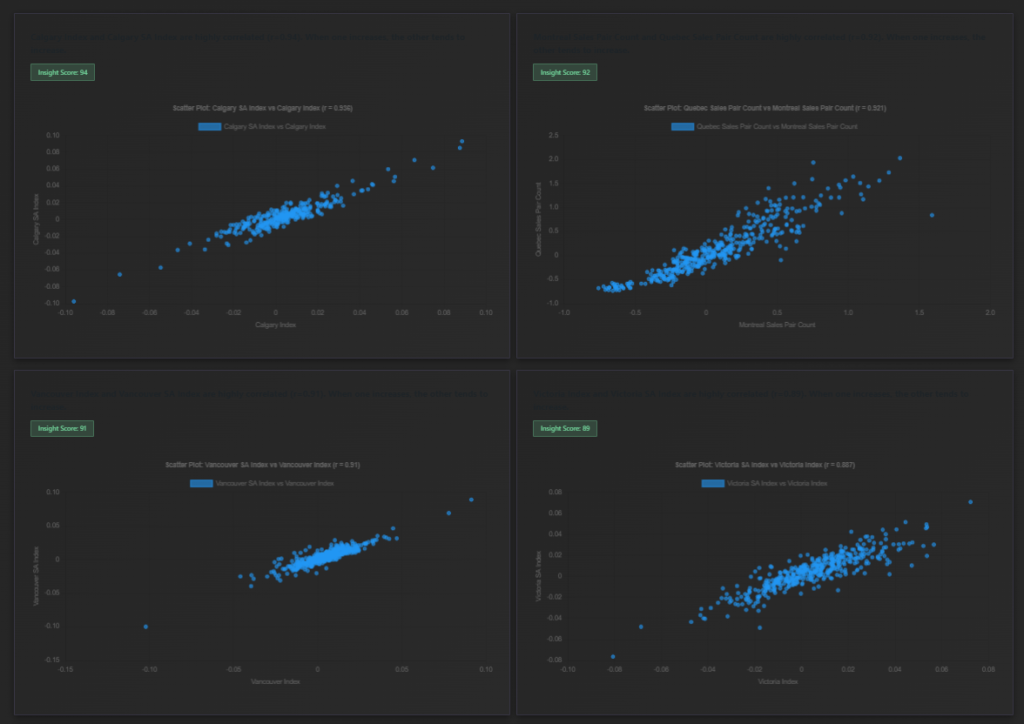
Traditional BI platforms show you charts — but they leave interpretation entirely to you. QuantumLayers goes further, running comprehensive statistical tests across your datasets automatically to surface patterns that matter: trends, outliers, correlations, and structural anomalies that would take a data scientist hours to find manually.
Automated Statistical Analysis – Pattern Detection Beyond Basic BI Dashboards
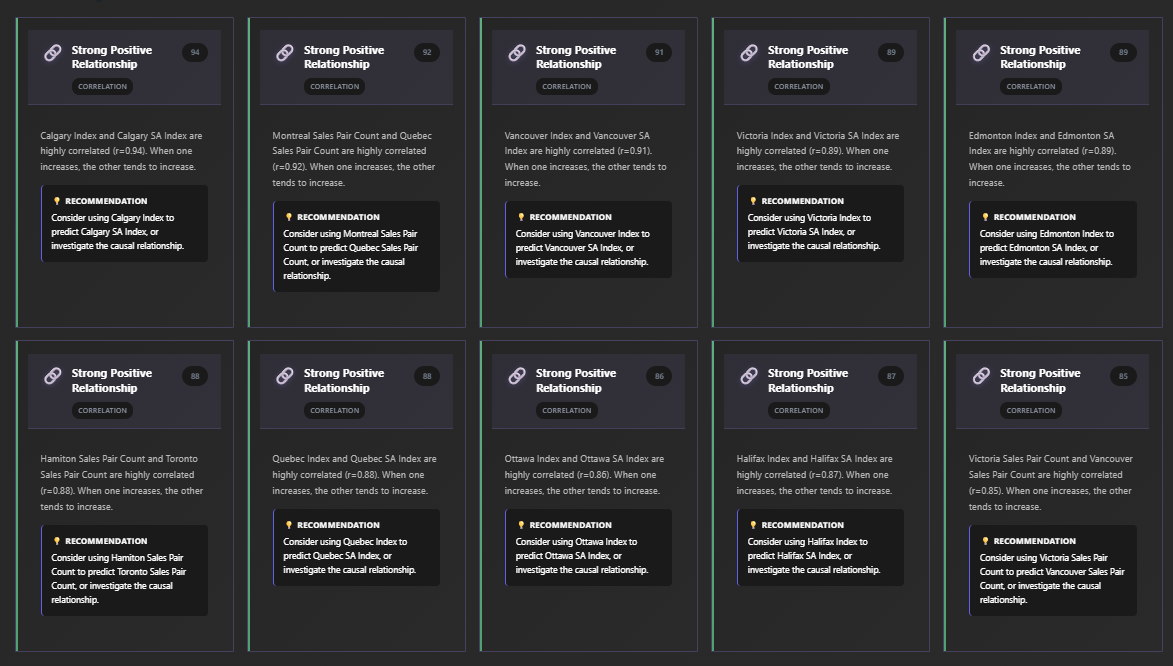
The platform ranks findings by statistical significance and practical business importance — surfacing the patterns that matter most, not just all patterns. Learn more about how statistical preprocessing powers QuantumLayers’ AI insights engine.
AI-Generated Business Insights – Plain-Language Analysis of Your Data
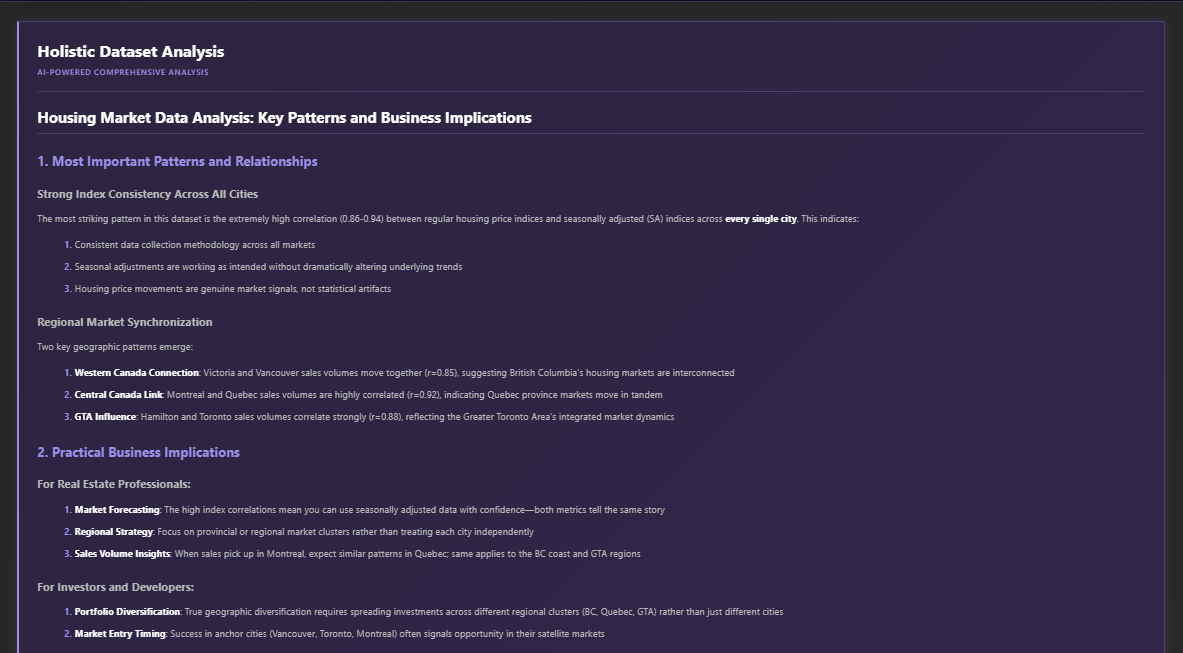
QuantumLayers integrates with leading AI language models to translate statistically validated findings into clear, actionable business language. Instead of leaving you to interpret p-values and F-statistics, the platform explains what your data means — and what you should consider doing about it.
Scheduled Reports Delivered at Your Doorstep

QuantumLayers automatically generates in-depth reports that embed AI insights, automatically suggested charts, and pre-designed saved charts for any number of dataset you want to be updated on. Get your insights delivered by email at daily, weekly or monthly frequencies, in HTML or PDF format.
Automate Your Workflows with QL-Agent
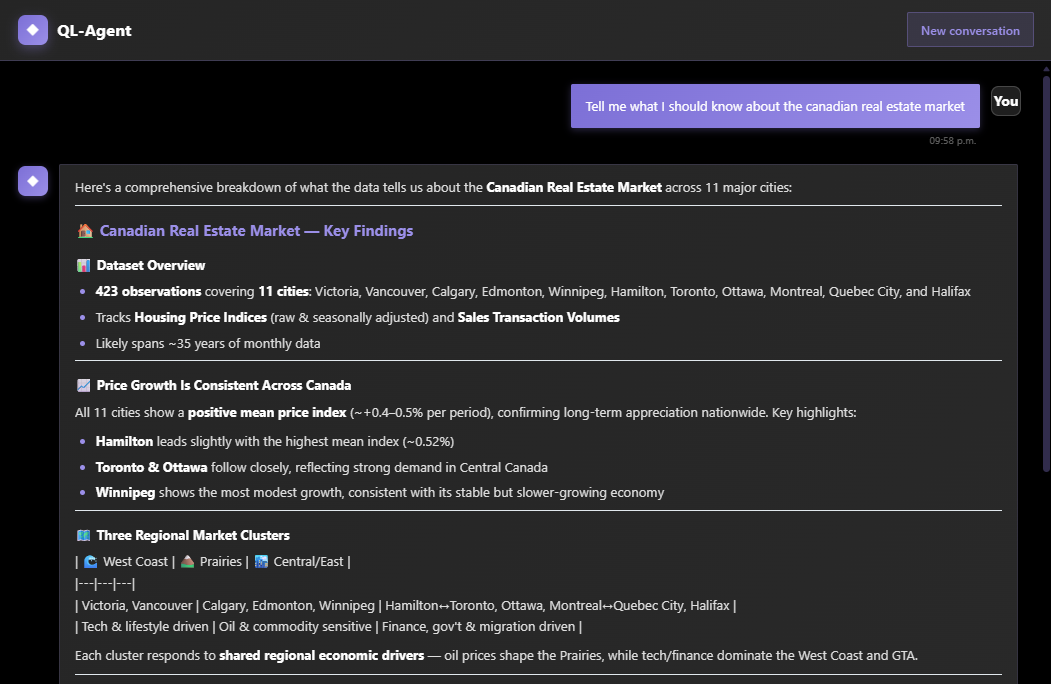
QuantumLayers makes ingestion, manipulation, visualization and interpretation as easy as it gets. But it can get even more automated through QL-Agent. Have QL-Agent assist in the creation and connection of your datasets, the design of SQL queries and API pull requests, the generation of your visualizations and the creation of scheduled reports within a single prompt. Learn more here.
Built for Teams That Can’t Afford a Full Data Engineering Stack
QuantumLayers was designed for the companies that need serious data analysis but don’t have a team of data engineers and BI developers to build it. If you’re running analytics with spreadsheets and one-off SQL queries today, QuantumLayers is built for you.
Growth & Marketing Teams
Connect your CRM, ad platform APIs, and revenue data. Understand which channels actually drive conversions — not just clicks.
E-Commerce & Retail
Merge order databases, inventory systems, and customer behavior data automatically. Spot product trends and churn signals before they hit your bottom line.
Operations & Finance
Pull operational metrics from your databases and financial exports into a single view. Detect cost anomalies and efficiency patterns without manual spreadsheet work.
–
How QuantumLayers Compares to Traditional BI Platforms
Legacy BI platforms are powerful — but they’re built for teams with dedicated BI developers and data engineers. They require significant setup time, ongoing maintenance, and technical expertise to operate. QuantumLayers takes a different approach: connect your data sources and receive statistically grounded, AI-interpreted insights automatically, with no configuration required.
| Feature | QuantumLayers | Traditional BI Platforms |
|---|---|---|
| Setup time | ✅ Minutes | ❌ Weeks to months |
| Data engineering required | ✅ None | ❌ Yes — ETL pipelines needed |
| Multi-source joining | ✅ Automatic | ❌ Manual schema work required |
| Chart selection | ✅ Automated | ❌ Manual drag-and-drop |
| Statistical analysis | ✅ Built-in, automatic | ⚠️ Limited or add-on only |
| AI-written insights | ✅ Included | ❌ Not included |
| Your data stays in your infrastructure | ✅ Yes | ⚠️ Varies by platform |
–
Our Partners
–
–
Frequently Asked Questions
Do I need a data engineer or SQL knowledge to use QuantumLayers?
No. QuantumLayers is designed for non-technical business users. You connect your data sources through a guided interface, and the platform handles schema analysis, joining, statistical processing, and visualization automatically. No SQL, no coding, and no data engineering experience needed.
How is QuantumLayers different from traditional BI platforms?
Traditional BI platforms require you to build data pipelines first, then manually configure dashboards. QuantumLayers automates the entire process: it connects to your sources, merges them, runs statistical analysis, generates visualizations, and explains what the patterns mean — no setup or technical expertise required.
What data sources can QuantumLayers connect to?
QuantumLayers connects to SQL databases (MySQL, PostgreSQL, SQL Server, MariaDB), REST APIs (including authenticated endpoints), SFTP storage, Google Sheets, and CSV files.
How does the AI insight generation work?
QuantumLayers runs rigorous statistical tests on your data first — correlations, ANOVA, trend analysis, outlier detection. The validated findings are then passed to an AI language model, which translates them into plain-language business insights. Read more in our deep dive on statistical preprocessing for AI analytics.
–
Learn More: Data Analytics Resources
New to automated data analytics? Our blog covers the key concepts behind how modern analytics platforms work — and how to get more from your data without building complex infrastructure.
–


Start analyzing your data today — no data engineer, no ETL setup, no credit card required.